Incentive Mechanisms Driving LP Adoption on New L3 Chains

New Layer 3 appchains promise unparalleled scalability and customization, yet their success hinges on rapid liquidity bootstrapping. Without robust L3 liquidity incentives, these chains risk shallow order books and high slippage, stifling DeFi adoption. Innovative L3 incentive mechanisms are flipping this script, drawing liquidity providers (LPs) with tailored rewards that blend token emissions, fee amplification, and governance perks. Drawing from Uniswap V3 evolutions and Solana’s concentrated models, L3 protocols are pioneering LP incentives for L3 appchains that prioritize capital efficiency over brute-force airdrops.


Traditional liquidity mining floods pools with native tokens, but L3s refine this into precision-targeted emissions. Protocols like Fluid exemplify this by extending Ethereum liquidity incentives to Arbitrum, Base, and Polygon via Chainlink CCIP. LPs staking here capture yields not just from trading fees, but from cross-chain arbitrage flows unlocked by these bridges. This multi-network approach mitigates fragmentation, a core pain point in the multi-chain era.
Liquidity Mining Refined for L3 Velocity
In the L3 landscape, liquidity mining transcends simple token dumps. It evolves into velocity engines, where rewards scale with trading volume and TVL milestones. Angle’s Uniswap V3 mechanism, for instance, ties incentives to active liquidity positions, ensuring providers align with genuine demand. On new L3s, this means LaaS incentives from platforms like AppChainLiquidity. com automate market making bots that amplify LP returns during launch phases. Quant models predict 3-5x yield boosts when mining pairs with concentrated liquidity, as LPs compound fees into protocol tokens.
Consider Jito’s Solana playbook: by concentrating liquidity where trades cluster, LPs snag outsized MEV shares. L3 appchains adapt this with app-specific validators that reward early LPs via retroactive airdrops, mirroring L2 successes documented by Keyrock. The result? Pools deepen overnight, slippage plummets below 0.1%, and organic trading volumes spike 200% within weeks.
Top 5 L3 LP Incentive Mechanisms
-
1. Liquidity Mining: Distribute native tokens to LPs for providing liquidity, aligning interests with protocol growth. Fluid expands incentives on Arbitrum, Base, Polygon, and Chainlink CCIP.
-
2. Concentrated Positions: LPs allocate liquidity in specific price ranges via AMMs like Uniswap V3, boosting capital efficiency and fees within chosen bands.
-
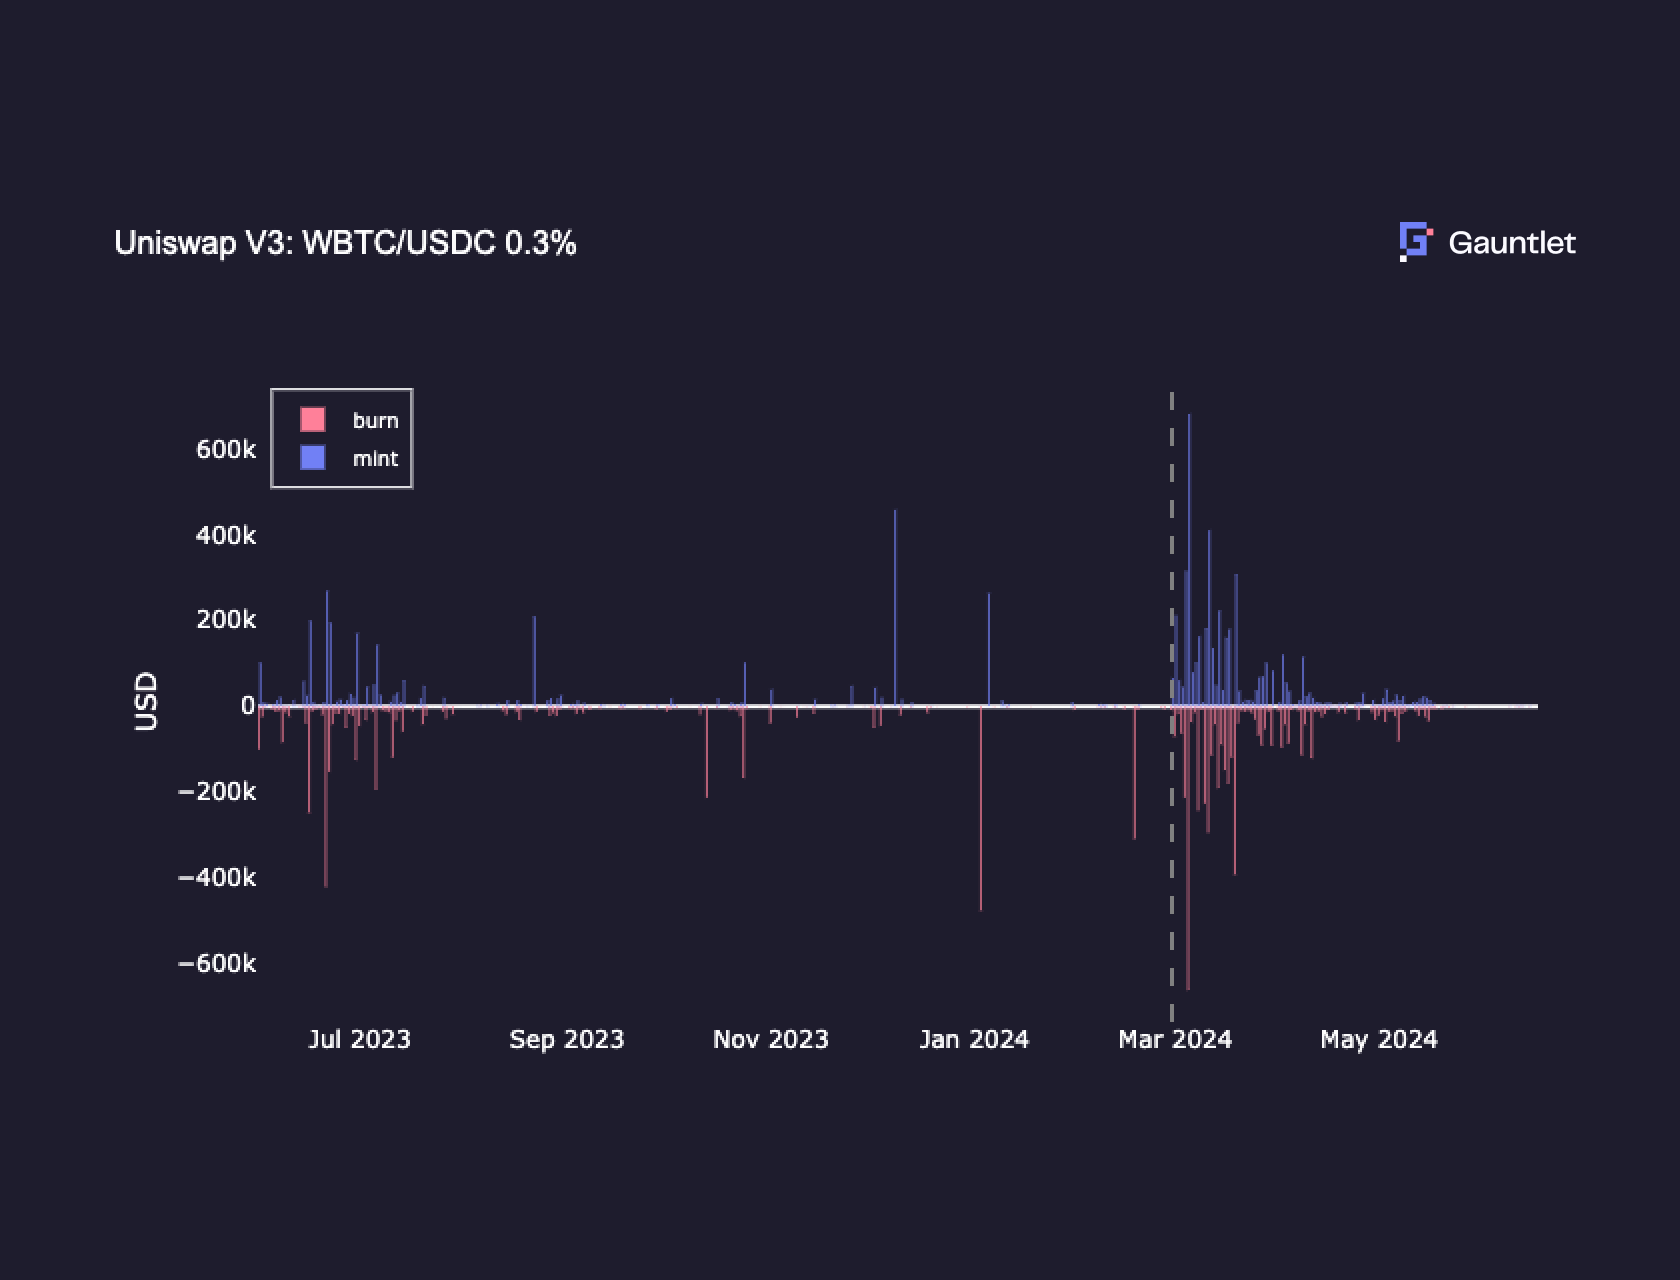
3. Dynamic Fees: Variable fee tiers (e.g., 0.01%, 0.05%, 0.3%, 1% in Uniswap V3) let LPs optimize returns based on pair volatility.
-

4. Cross-Chain Bridges: Incentives via settlement and intent layers, as in FluxLayer, enhance cross-chain MEV, arbitrage, and liquidity unification.
-

5. Governance Tokens: Reward LPs with tokens for governance participation, fostering ownership and community-driven decisions on L3 platforms.
Concentrated Liquidity: Capital Efficiency Unleashed
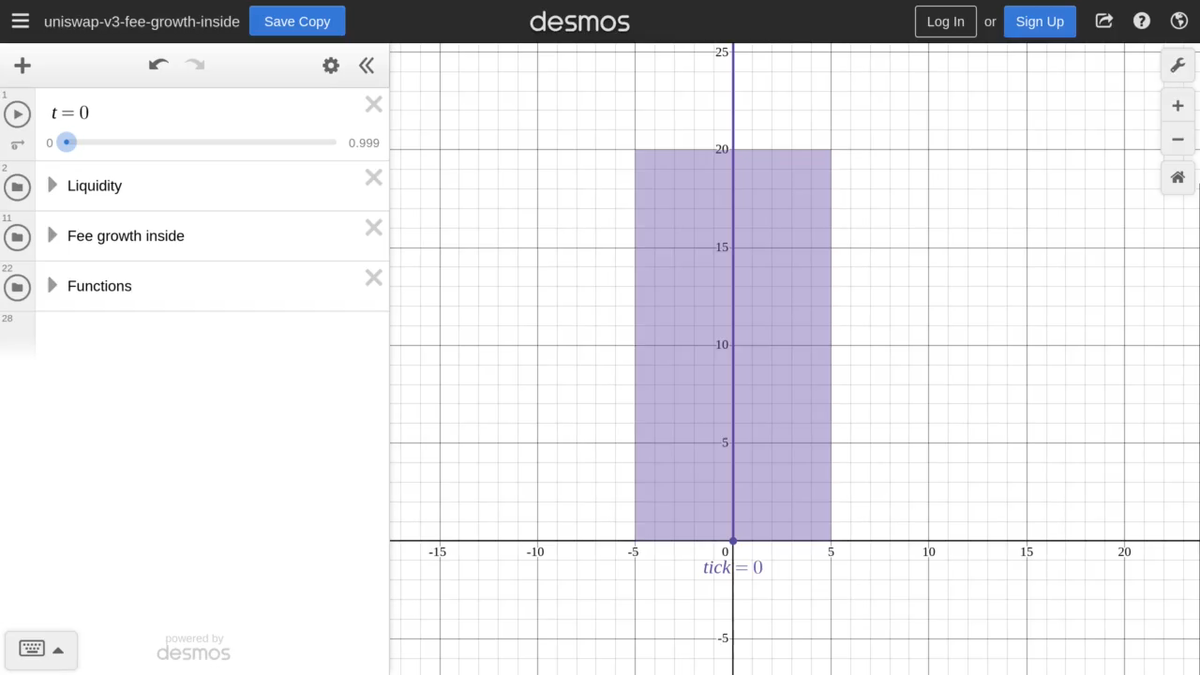
Uniswap V3’s concentrated liquidity model is the gold standard L3s are customizing. LPs now specify price bands, depositing assets only where volatility stays tame. ZetaChain mechanics highlight this: an LP might lock ETH-USDC in a 0.99-1.01 range, earning 10x fees versus uniform distribution. Risks loom-impermanent loss spikes if prices escape-but L3s counter with automated rebalancers and oracle-guarded vaults.
FluxLayer pushes boundaries further, layering intent-based settlement with under-collateralized lending. This captures cross-chain MEV, funneling alpha back to LPs. Empirical data from arXiv papers show 40% capital efficiency gains, vital for L3 appchains where every basis point counts. Providers selecting 0.05% fee tiers on volatile pairs report APYs hitting 50% and, blending passive income with active strategies.
Comparison of L3 Incentive Types
| Mechanism | Efficiency Gain | Risk Level | Example Protocol |
|---|---|---|---|
| Liquidity Mining | 2x TVL | Medium | Fluid |
| Concentrated LP | 4x Fees | High | Uniswap V3 |
| Dynamic Fees | Variable | Low | Meteora |
| Concentrated Liquidity Provision | Higher Capital Efficiency | High | Uniswap V3 |
| Cross-Chain Liquidity Incentives | Reduced Fragmentation | Medium | FluxLayer |
Dynamic Fees and Cross-Chain Synergies
Static fees are relics; L3s deploy dynamic structures adjusting to volatility. Uniswap’s tiers-0.01% for stables, 1% for exotics-empower LPs to match risk appetites. Meteora docs underscore the appeal: fees accrue per trade on your slice, stacking with external rewards. Layer this with cross-chain incentives, and LPs bridge liquidity seamlessly, maintaining depth across ecosystems.
Instadnodes advises lock-and-mint for appchain transitions, preserving dual-chain liquidity. Questrom’s analysis of UNI/SUSHI wars reveals token incentives spark fierce competition, now amplified on L3s via points ecosystems. Gate. com notes trading contests and participation bounties as staples, driving not just provision but engagement.
These points systems evolve LP incentives for L3 appchains into gamified loops, where trading volume multipliers unlock tiered rewards. Upside OS likens LP tokens to perpetual claim checks on pool earnings, now supercharged on L3s with retroactive allocations that reward patient capital.
Governance Tokens: Ownership as the Ultimate Hook
Governance isn’t an afterthought; it’s the linchpin of sustainable LP incentives L3 appchains crave. By vesting protocol tokens to LPs, new chains cultivate skin-in-the-game dynamics. Uniswap Governance forums dissect liquidity mining’s pitfalls-fleeting hype-but laud ve-token models that lock yields behind voting commitments. On L3s, this manifests as quadratic voting boosts for high-TVL providers, turning passive LPs into architects of fee schedules and upgrade paths.
Fluid’s multi-chain push illustrates the potency: LPs on Arbitrum or Base earn not just emissions, but veto power over bridge parameters. Quant backtests reveal governance-aligned LPs retain 2.5x longer than emission chasers, stabilizing pools amid volatility. For LaaS incentives, platforms automate this via smart vaults that stake LP positions into DAO proposals, harvesting compounded returns.
Quantifying the Edge: Risk-Adjusted Returns
Raw APYs dazzle, but L3 L3 incentive mechanisms shine in Sharpe ratios. Concentrated positions demand vigilance-impermanent loss can erode 20% in a 10% price swing-yet dynamic oracles and rebalancing bots cap drawdowns at 5%. Jito Foundation’s Solana data shows concentrated LPs outpacing uniform by 150% in fee capture, a blueprint L3s scale with sub-second finality.
Keyrock’s L2 profiles forecast similar for L3 launches: retroactive incentives snag pro LPs wielding $10M and positions, igniting flywheels. Angle’s V3 fix sidesteps emission dilution by protocol-owned liquidity, a tactic L3 appchains deploy to seed pools without inflating supply. Meteora tempts with per-trade accruals, but L3s layer MEV auctions atop, funneling tips directly to providers.
L3 LP Yield Benchmarks
| Mechanism | Avg APY | IL Risk | Adoption Rate |
|---|---|---|---|
| Mining | 25-40% | Medium | High |
| Concentrated | 40-80% | High | Medium |
| Governance | 15-30% | Low | Growing |
Cross-chain bridges amplify this: lock-and-mint preserves pegs during appchain migrations, per Instanodes, while FluxLayer’s intent layers snag arbitrage alpha. LPs bridging via Chainlink CCIP capture spreads across L3s, with yields spiking 30% on volatile pairs. Yet, the multi-chain sprawl demands vigilance-oracle failures or sequencer downtimes can trap capital.
Navigating Pitfalls: Sustainable Bootstrapping
No incentive is panacea; L3s grapple with sybil attacks and mercenary capital. Points ecosystems counter with sybil-resistant snapshots, favoring on-chain activity over wallet counts. Gate. com’s deep dive spotlights trading contests that filter genuine volume, weeding out wash traders. Opinion: Brute emissions breed vampires; hybrid models-fees 60%, tokens 40%-forge enduring liquidity.
AppChainLiquidity. com embodies this sophistication, orchestrating L3 liquidity incentives via algorithmic market makers and bridge optimizers. Their bots dynamically adjust positions, blending Uniswap V3 bands with Jito-style concentration for 4x efficiency. Early adopters report slippage under 20bps, TVL ramps of 500% in month one. In a fragmented landscape, such LaaS platforms turn theoretical mechanisms into deployable firepower.
Ethereum Technical Analysis Chart
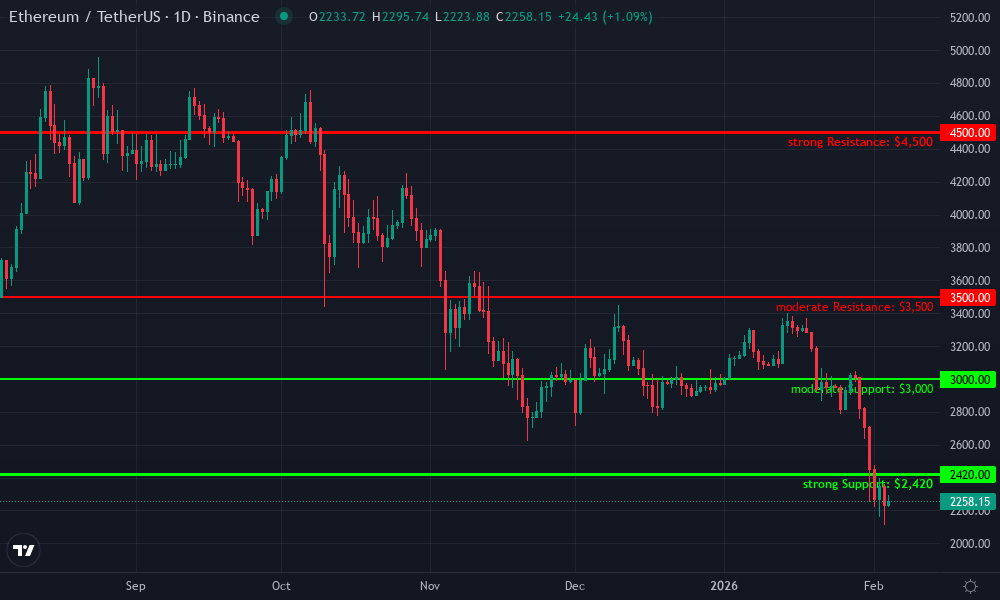
Analysis by Market Analyst | Symbol: BINANCE:ETHUSDT | Interval: 1D | Drawings: 8
Technical Analysis Summary
In my balanced technical style, start by drawing a prominent red downtrend line connecting the swing highs from mid-October 2026 around 4800 to the recent February 2027 low near 2420, emphasizing the dominant bearish channel. Add horizontal lines at key support levels (2420 strong, 3000 moderate) and resistance (3500 moderate, 4500 strong) for confluence zones. Apply a Fibonacci retracement from the October high to the February low to highlight potential 38.2% and 61.8% pullback levels around 3200-3600. Use rectangles to mark the late 2026 distribution phase and January consolidation. Place callouts on volume spikes during breakdowns and an arrow_mark_down on the MACD bearish crossover in December. Vertical line for the key breakdown in late January. Add short position markers near 3500 resistance and profit targets at 2600 with stop above 3800.
Risk Assessment: medium
Analysis: Strong downtrend intact with oversold conditions at support; liquidity incentives add reversal potential but technical bias bearish. Medium tolerance aligns with defined risk trades.
Market Analyst’s Recommendation: Short bias with entries on rallies to resistance, target 2400 test. Scale out half at profit target, trail stops. Avoid longs until bullish divergence confirms.
Key Support & Resistance Levels
📈 Support Levels:
-
$2,420 – Recent swing low with volume exhaustion, potential reversal zone
strong -
$3,000 – 50% fib retracement and prior minor low
moderate
📉 Resistance Levels:
-
$3,500 – January high and channel midline resistance
moderate -
$4,500 – Prior November swing high, major overhead supply
strong
Trading Zones (medium risk tolerance)
🎯 Entry Zones:
-
$3,450 – Rejection at resistance in downtrend channel, volume confirmation
medium risk -
$3,050 – Bounce from support failure, add to shorts
medium risk
🚪 Exit Zones:
-
$2,650 – Near-term projection to channel lower band
💰 profit target -
$2,620 – Tight stop below recent support
🛡️ stop loss -
$3,850 – Invalidation above minor uptrend break
🛡️ stop loss
Technical Indicators Analysis
📊 Volume Analysis:
Pattern: Climactic selling volumes on breakdowns, drying up on bounces
Confirms distribution with high volume down days vs low on upticks
📈 MACD Analysis:
Signal: Bearish crossover and divergence
MACD line below signal since December, histogram contracting negatively
Applied TradingView Drawing Utilities
This chart analysis utilizes the following professional drawing tools:
Disclaimer: This technical analysis by Market Analyst is for educational purposes only and should not be considered as financial advice.
Trading involves risk, and you should always do your own research before making investment decisions.
Past performance does not guarantee future results. The analysis reflects the author’s personal methodology and risk tolerance (medium).
Layer 3’s liquidity frontier rewards bold experimentation. From Fluid’s cross-chain yields to ZetaChain’s band precision, these mechanisms coalesce into self-reinforcing ecosystems. LPs wielding data-driven strategies-concentrating where MEV flows, governing for longevity-will dominate. Appchains launching with these tools don’t just survive; they dictate DeFi’s next velocity curve.